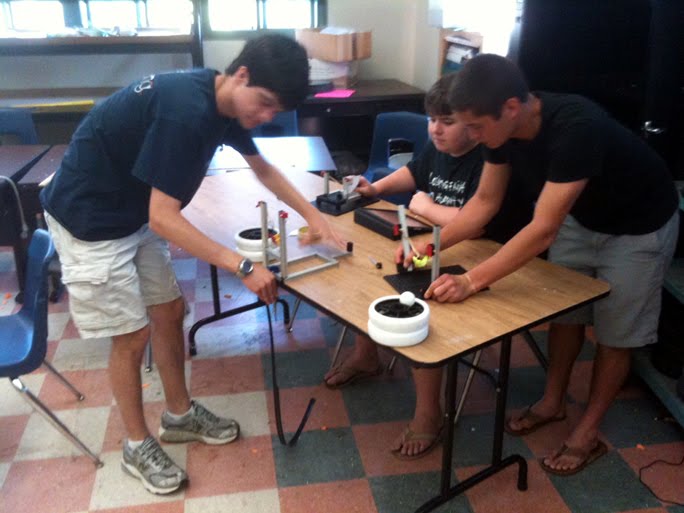
To get the year going, we're going to revisit the
POE Final Challenge from the last day of class last year.
This is a great opportunity to start working with a team and see how we can take data, visualize it and then use the data to make choices regarding overcoming a challenge. This is a "game" so please approach the challenge with a spirit of fun! I hope we can enjoy kicking off the year with this as a first (of at least two) warm up project(s).
Phase 1: Design/Build
Construct a ping pong ball launcher according to the following criteria and constraints:
Criteria
-Adjustable launch trajectory (use provided protractor) or adjustable pull.
-Be able to launch a ping pong ball within a range bracket of 10 to 20 feet.
-Be as accurate and precise as possible within this range window (significant to next phases)
Constraints
-Use provided materials (Fischertechnik, rubber bands, popsicle sticks, pipecleaners)
-Limited adhesives/tape - no major structural dependency on tape
Document your launcher by posting a photograph to your blog. Briefly list any key features of your design.
Phase 2: Test & Visualize Data
-Collect a minimum of ten data points (you may want to do more).
-Correlate launch angle or pull distance (depending on which design you pursued) with distance ball traveled.
-Put your data into Power Point and visualize it with a graph of Angle/pull vs. Distance
Post your Power Point graph to your blog
Phase 3: Friendly Competition
We will hold a target practice tournament with our launchers. Using a competitive bracket, teams will be paired up and take turns to see who can be first to hit a target placed between 10 and 20 feet from their launchers. Winners will advance.
List how far you were able to advance in the tournament
Phase 4: Clean Up
Have your launcher fully broken down and parts returned to their bins by the completion of the period.